1 Revenue Growth
Year-on-year CER sales growth including new products and excluding revenue from acquired businesses. | ↑ 8.9% | Dechra's existing business grew by 7.8% in EU Pharmaceuticals (excluding third party contract manufacturing which declined), and by 15.4% in NA Pharmaceuticals. |  
 
A key driver of our strategy is to deliver sustainable sales growth through delivering our pipeline, maximising our existing portfolio and expanding geographically.
|
2 Underlying Diluted EPS Growth
Underlying profit after tax divided by the diluted average number of shares, calculated on the same basis as note 11 to the Accounts.
 | ↑ 16.6% | This includes a 27.3% increase in underlying operating profit partially offset by higher finance costs from the increase in debt and equity issuance to fund acquisitions. |
Underlying diluted EPS is a key indicator of our performance and the return we generate for our stakeholders. It is one of the performance conditions of the LTIP. |
3 Return on Capital Employed
Underlying operating profit expressed as a percentage of the average of the opening and closing operating assets (excluding cash/ debt and net tax liabilities).
| ↑ 10bps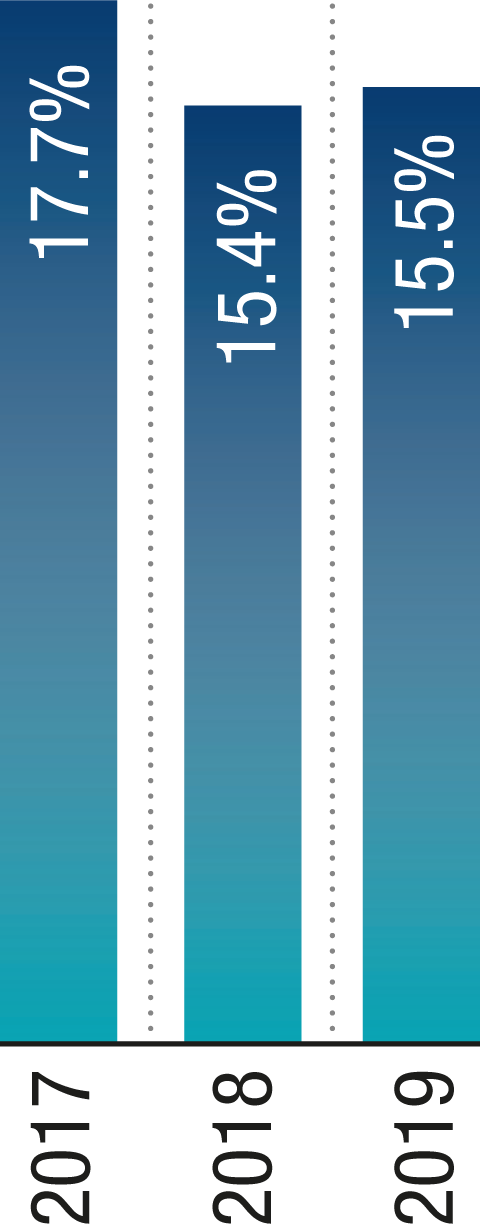 | There was a small improvement in ROCE during the year as we continue to consolidate acquisitions and leverage the asset base. |
As we look to grow the business, it is important that we use our capital efficiently to generate returns superior to our cost of capital in the medium to long term. It underpins the performance conditions of the LTIP. |
4 Cash Conversion
Cash generated from operations before tax and interest payments as a percentage of underlying operating profit. | ↑ 310bps | Cash conversion improved during the year despite the increase in inventory as a result of Brexit and also the growth of the Group. |
Our stated aim is to be a cash generative business. Cash generation supports investment in the pipeline, acquisition and people. |
5 New Product Revenue
Revenue from new products as a percentage of total Group revenue. A new product is defined as any molecule launched in the last five financial years. | ↑ 480bps | New product revenues reflect the strong market penetration of products launched in the year to 30 June 2019 and the previous four years. |
This measure shows the delivery of revenue in each year from new products launched in the prior five years, on a rolling basis. It shows the performance of our R&D and sales and marketing organisations when launching newly developed or in-licensed products. |
6 Lost Time Accident
Frequency Rate (LTAFR)
All accidents resulting in the absence or inability of employees to conduct the full range of their normal working activities for a period of more than three working days after the day when the incident occurred, normalised per 100,000 hours worked. | * excludes AST Farma and Le Vet | The LTAFR increased from nil to 0.21. None of these incidents resulted in a work-related fatality or disability. |  
The safety of our employees is core to everything we do. We are committed to a strong culture of safety in all our workplaces.
Read more about Corporate Social Responsibility |
7 Employee Turnover
Number of leavers during the period as a percentage of the average total number of employees in the period. | ↓ 230bps * excludes RxVet, AST Farma and Le Vet
† excludes Venco | We saw a decrease in employee turnover in the period despite operating in competitive markets. |
Attracting and retaining the best employees is critical to the successful execution of our strategy. |